Predicting stock price movements is one of the most exciting applications of data analytics in the finance domain. With the rapid growth of fintech, skills like time-series forecasting, financial modeling, and stock trend analysis are becoming essential for students who want to build a strong career in finance, data analytics, business analytics, investment banking, or quantitative roles.
In this project, students work on real stock market data and learn how modern financial models are built and used in the industry.
Project Overview
Project Name: Market Movement Forecasting Using Historical Stock Prices
Data Source: Yahoo Finance API / yfinance
Tools/Libraries: pandas, numpy, matplotlib, scikit-learn, statsmodels
Outcome: Students perform time-series analysis and build forecasting models to predict stock price trends.
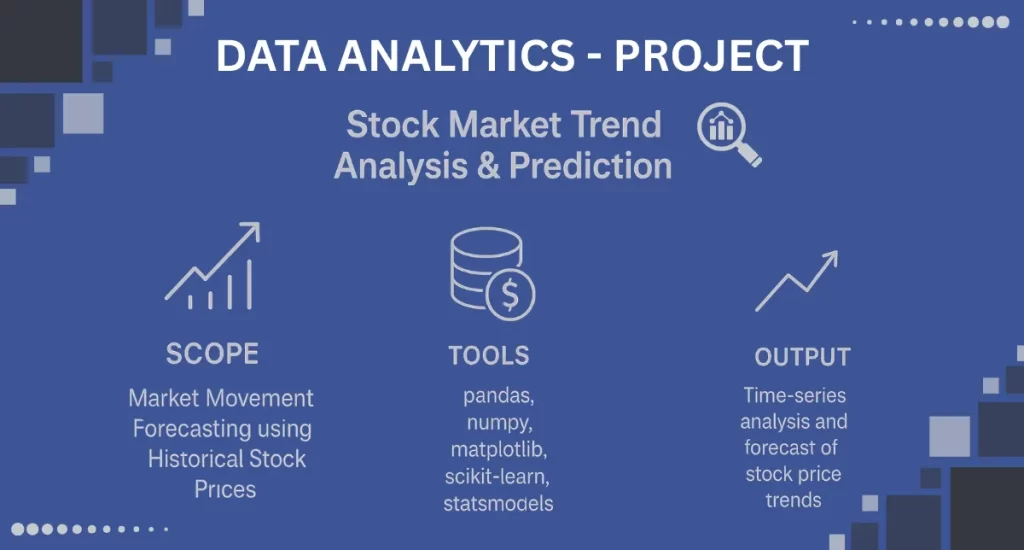
What This Project Is About
In this project, learners collect real-time historical stock price data using the popular Python library yfinance, which provides open access to Yahoo Finance data.
Step-by-Step Learning Journey
1. Data Extraction from Yahoo Finance
Students learn to automatic data fetching.
This builds a strong foundation in API usage, data gathering, and working with financial datasets.
2. Exploratory Data Analysis (EDA)
Students perform EDA (Exploratory Data Analysis) to understand:
✔ Market behavior
✔ Patterns in stock prices
✔ Price spikes and sudden drops
✔ Long-term trends and anomalies
3. Computing Technical Indicators
Learners compute popular stock market indicators used by traders and analysts:
Moving Average (MA10, MA50, MA200)
Relative Strength Index (RSI)
Bollinger Bands
Volatility
Exponential Moving Average (EMA)
These indicators help students understand momentum, trend strength, and market direction.
4. Building Forecasting Models
Students build multiple models to predict future stock trends:
ARIMA (Auto-Regressive Integrated Moving Average)
Used for time-series forecasting
Helps predict short-term price movements
Prophet (Developed by Facebook/Meta)
Captures seasonality
Handles trend changes smoothly
Great for daily/weekly price predictions
Machine Learning Models
Random Forest Regressor
Gradient Boosting Regressor
Linear Regression
Students compare model accuracy using metrics such as:
MAE (Mean Absolute Error)
RMSE (Root Mean Squared Error)
This teaches them how model comparison and hyperparameter tuning are done in real-world projects.
5. Trend, Seasonality & Anomaly Detection
Using decomposition and advanced visualization, students identify:
Long-term upward/downward trends
Seasonal patterns (monthly, weekly)
Sudden price shocks
Market anomalies
This is a key skill used in quant research, trading desks, and financial analytics teams.
What Students Learn from This Project
By the end of this project, learners gain strong practical skills in:
Technical Skills
✔ Python for finance
✔ Time-series forecasting
✔ Financial data analysis
✔ Stock market indicators
✔ Model building with ARIMA & Prophet
✔ Machine Learning for forecasting
✔ Data visualization
Looking to do projects in Advanced Data Analytics:
Want to start a career in Data Analytics and AI. At Tech Concept Hub, Pune, we offer an industry-designed training program that takes you from basics to advanced projects. Build job-ready skills in Data Analytics, Machine Learning, Deep Learning, and Generative AI with our practical training program. Learn with live projects, real datasets, and mentorship from industry experts.
Data Analytics Syllabus: https://techconcepthub.com/data-analytics-course-in-pune/
Gen AI Syllabus: https://techconcepthub.com/generative-ai-course-in-pune/