In today’s digital age, e-commerce companies rely heavily on data analytics to understand their customers and boost sales. One of the most powerful techniques used in the retail industry is customer segmentation—dividing customers into meaningful groups based on their behavior.
This project gives students real-world experience in e-commerce analytics using RFM modeling and clustering techniques.
Project Overview
Project Name: RFM-Based Customer Segmentation for an Online Store
Industry: Retail / E-commerce
Data Source: Kaggle — E-Commerce Transactions Dataset
Tools/Libraries: pandas, numpy, scikit-learn, seaborn, matplotlib
Outcome: Segmented customer groups such as loyal, new, and at-risk customers using clustering algorithms.
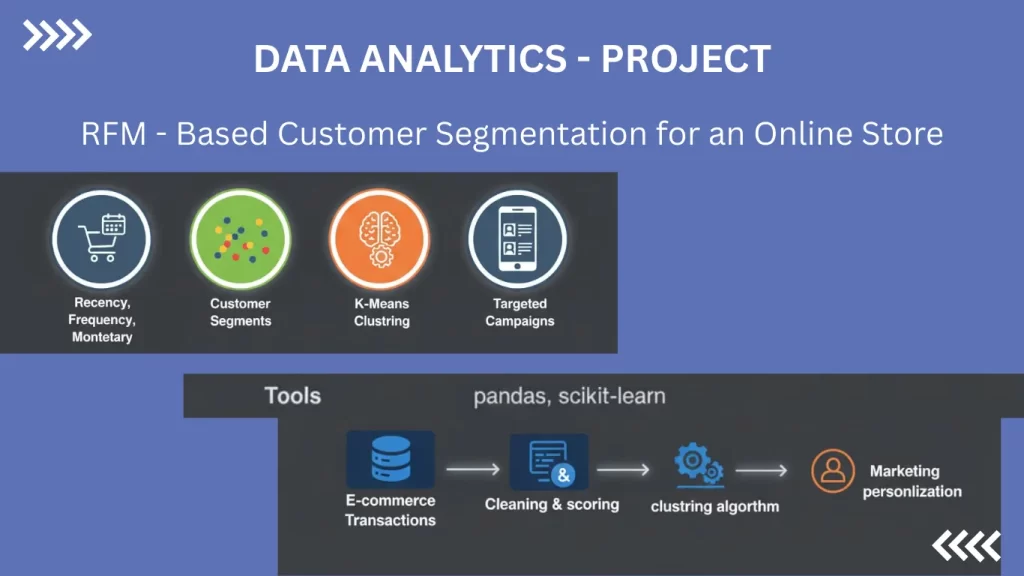
This project focuses on analyzing real e-commerce transaction data to understand customer purchasing patterns. Students work with historical order records. The goal is to identify distinct customer segments so businesses can personalize marketing, improve retention, and increase revenue.
Step-by-Step Learning Journey
1. Data Cleaning & Preparation
Students start by cleaning the raw dataset. This teaches them how to work with real messy e-commerce data, preparing it for analysis.
2. Feature Engineering
The next step is creating new meaningful features:
Total revenue per customer
Purchase frequency
Days since last purchase
Average order value
Feature engineering is crucial in building accurate customer insights.
3. Understanding RFM Model
RFM is a widely used customer analytics technique in retail:
R — Recency: How recently a customer purchased
F — Frequency: How often they purchase
M — Monetary: How much they spend
Students calculate RFM scores and standardize them for clustering.
Through this, they learn how retailers evaluate customer lifetime value and buying behavior.
4. Clustering & Customer Segmentation
Students apply clustering algorithms such as:
K-Means Clustering
Used to group customers based on RFM scores into segments like:
Loyal Customers
High-Value Customers
New Customers
At-Risk Customers
Low-Value Customers
Hierarchical Clustering
Helps visualize how customer groups are formed step-by-step.
This teaches learners how machine learning helps businesses make data-driven decisions.
5. Data Visualization
Students visualize cluster patterns using:
Scatter plots
Cluster heatmaps
RFM distribution charts
Spending behavior by customer groups
Visual storytelling helps them interpret:
✔ Who are the top spenders?
✔ Who buys frequently but spends less?
✔ Who stopped buying recently?
✔ Which customers need re-engagement?
6. Customer Lifetime Value (CLV) Analysis
Students calculate:
Average revenue per customer
Predicted long-term value
Potential future contribution
This is extremely important in e-commerce strategy and digital marketing.
What Students Learn from This Project
Technical Skills
✔ Data cleaning and preprocessing
✔ RFM scoring and feature engineering
✔ K-Means and hierarchical clustering
✔ Python libraries for analytics
✔ Data visualization and storytelling
✔ Customer lifetime value (CLV) techniques
Looking to do projects in Advanced Data Analytics:
Want to start a career in Data Analytics and AI. At Tech Concept Hub, Pune, we offer an industry-designed training program that takes you from basics to advanced projects. Build job-ready skills in Data Analytics, Machine Learning, Deep Learning, and Generative AI with our practical training program. Learn with live projects, real datasets, and mentorship from industry experts.
Data Analytics Syllabus: https://techconcepthub.com/data-analytics-course-in-pune/
Gen AI Syllabus: https://techconcepthub.com/generative-ai-course-in-pune/