Build an AI powered project “SmartFinance Insight“.
SmartFinance Insight is a data analytics and machine learning–based application designed to analyze multiple bank statements automatically and generate actionable financial insights.
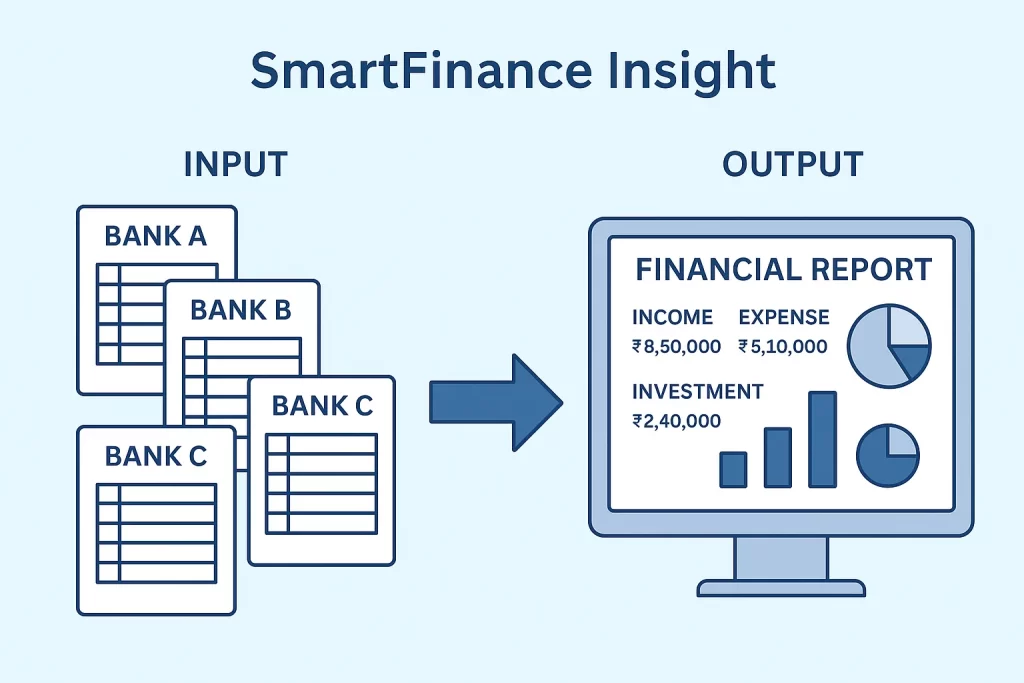
The application reads and processes bank statements (PDF/CSV/Excel formats) from different banks, classifies transactions using ML-based labelling, and provides interactive reports showing your income, expenses, and investments.
Users can filter data by time period (month/year) and drill down from high-level summaries (like total income) to individual line items (specific transactions).
It’s an ideal real-world project that integrates:
Data extraction and preprocessing
Natural language processing (NLP) for transaction description classification
Machine learning for automatic categorization of transactions
Data visualization and interactive reporting using analytics dashboards
Report generation (PDF output)
Functional Requirements
1️⃣ Input:
Multiple bank statements from different banks (formats: CSV, Excel, PDF).
Each statement may contain columns like Date, Description, Amount, Credit/Debit, Balance.
2️⃣ Processing:
Data cleaning & normalization (convert all banks’ statements into a standard format).
Categorization of each transaction into:
Income (salary, rent, refunds, etc.)
Expense (groceries, travel, shopping, utilities, etc.)
Investment (FD creation, mutual funds, stocks, SIPs, etc.)
ML Component:
Build a text classification model (using transaction descriptions) to predict category labels (income/expense/investment).
Example:“FD creation with HDFC” → Investment,
“Salary credit” → Income,
“Amazon payment” → Expense.
3️⃣ Exclusion Rules:
If an FD is matured (principal + interest credited), exclude from income.
If FD is created, mark as investment.
Money moved to mutual funds or shares → investment.
Output Reports:
a. Summary Report
Total Income
Total Expense
Total Investment
Net Savings
b. Comparative Report
Income vs Expense vs Investment chart (monthly/yearly trend)
c. Drill-down
Click on total income → see all income transactions
Click on expense → see categorized expense details (e.g., food, rent, travel)
d. Time Frame Filter
User can select:
From Year/Month → To Year/Month
Example: “Jan 2023 to Sep 2024”
e. Export Feature
Export summary and detailed report as PDF (for record keeping or sharing)
Technology Stack
| Layer | Tools / Technologies |
|---|---|
| Frontend | Streamlit / Dash / React (for dashboard UI) |
| Backend | Python (Flask / FastAPI) |
| Data Processing | Pandas, NumPy |
| ML Model | Scikit-learn / spaCy / Hugging Face (for text classification) |
| Visualization | Matplotlib / Plotly / Power BI embedding |
| PDF Generation | ReportLab / FPDF / pdfkit |
| Storage | SQLite / PostgreSQL (for transaction data) |
Learning Outcomes
By completing this project, you will:
Learn data cleaning and normalization from multi-bank statements.
Use machine learning to label financial transactions intelligently.
Build interactive analytics dashboards and visualizations.
Understand real-world financial reporting logic (income vs expense vs investment).
Implement PDF report automation.
Learn to integrate data analytics + AI + visualization in one cohesive application.